The bees are disappearing. The American bumblebee has declined by 90% in relative abundance and continues to decline toward extinction. Several other species of bumblebees are endangered, and more may be soon to follow. Many plants, such as oak and maple trees, benefit from bumble bee pollination, and bumble bees are the only known pollinator of the potato worldwide.
Honeybees have suffered, too. Since 2006, commercial beekeepers in the United States have lost on average 30 percent of their honeybee colonies each winter, compared to historical loss rates of 10 to 15 percent. Honeybees are vital to many agricultural practices. More than 90 crops rely on bee pollination, and the European honey bee is the most common pollinator. About one-third of our food comes from crops pollinated by honey bees, including apples, pumpkins, broccoli, and almonds. Bumblebees and honeybees both need our help.
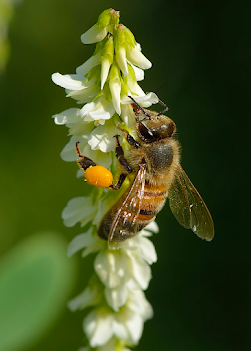 |
| [1] Honey bee on clover |
A major factor in the decline in native bee populations is destruction of habitat. Pesticides, intensive farming, and climate change have all depleted bees’ food sources and decreased their range. But all hope is not lost. Pesticides shown to kill bees have been banned in Europe and could become restricted in California. Many organizations have sprung up to try to help the bees. For example, Project Apis m. aims to help honeybees and Xerces Society is focused on native bees. We are trying to help, too.
In our area, native California buckwheat flowers are an important source of food for both native bees and honeybees. If we are able to easily track the distribution of buckwheat flowers, we can learn more about how bees’ food sources are changing, helping us understand their nutrition and habitat. However, assessing the location and density of these flowers is difficult. Our approach involves using drone images of the plants and then counting the density of flowers in each one.
 |
| [2]: Example image from dataset |
However, this is more difficult than it might seem. Many of the plant images have rocks and other variations in color, which makes it difficult to automatically identify what is a flower and what is just ground. We are learning about computer vision machine learning methods to automate this process.
There are two different paradigms that could apply to a problem like this: counting by detection and counting by regression. Counting by detection involves finding all the flowers to figure out their density in the image, while counting by regression generates a map of flower density that we can then use to determine how much of the image is flower compared to other things.
Both of these approaches are imperfect for our application. Counting by regression is often used to count the number of people in a crowd, and it is not clear that the same approach would be good for counting flowers since flowers clump together and have less distinctive shapes. We have not yet tried to implement this, as there is more documentation of counting by detection, so we are starting there.
 |
[3]: Counting by detection for agriculture |
Counting by detection uses neural networks that are generally meant for identifying large parts of an image as a particular object. We are not sure that these methods would perform well at recognizing many tiny flowers in an image, but we are hopeful because a variation of this method, Faster R-CNN, appears to work fairly well for identifying and counting plants in an agricultural context. Faster R-CNN uses a Region Proposal Network, which inspects each region of the image to estimate how likely an object is to appear there, combined with a classifier that then identifies the objects in these regions. Because this looks at every smaller region of an image, this can make Faster R-CNN work well for identifying the many small flowers in our images.
As always, there are many problems to work through to get the code to work on our images, but we think we are close! We had to convert the images to the right format, tune hyperparameters, and make changes to the code so it would work for us. Once we get a model, we will have to test it and, depending on our results, either improve it or try a different approach. If we are successful, we will be able to easily quantify flower density over a large area, telling us more about the availability of a food source important to both honeybees and native bees. We hope that our final method will be fairly easily applicable to other species of flowers as well. By learning more about the bees’ habitat, we will learn more about how to help them. We are enjoying learning about bees and computer vision as we go!
Further Reading:
A. S. Gomez, E. Aptoula, S. Parsons and P. Bosilj, "Deep Regression Versus Detection for Counting in Robotic Phenotyping," in IEEE Robotics and Automation Letters, vol. 6, no. 2, pp. 2902-2907, April 2021, doi: 10.1109/LRA.2021.3062586
“Are Bees Endangered? Here's Everything You Need to Know.” Brightly,
https://brightly.eco/blog/are-bees-endangered.
“How You Can Keep Bees from Becoming Endangered.” The Ohio State University,
https://www.osu.edu/impact/research-and-innovation/bee-population.
McAfee, Alison. “The Problem with Honey Bees.” Scientific American, Scientific American, 4 Nov. 2020, https://www.scientificamerican.com/article/the-problem-with-honey-bees/.
Media Credits:
[1]: Photo by Ivar Leidus, CC BY-SA 4.0, via Wikimedia Commons
https://commons.wikimedia.org/wiki/File:Apis_mellifera_-_Melilotus_albus_-_Keila.jpg
[2]: Image from Bee Lab dataset
[3]: Figure from github provided by Gomez, Adrian Salazar, et al. “Deep Regression versus Detection for Counting in Robotic Phenotyping.” IEEE Robotics and Automation Letters, vol. 6, no. 2, 2021, pp. 2902–2907., https://doi.org/10.1109/lra.2021.3062586.
No comments:
Post a Comment